


PGNiG on the stock exchange
In 2012, the PGNiG stock price was very volatile. Generally, the year was a period of intense volatility on the capital markets, both in Poland and globally. Towards the end of 2012, PGNiG stock peaked at PLN 5.21 (up by 28% on the year’s beginning), which was a good sign for the year ahead.
Our position on the Warsaw Stock Exchange
From the day PGNiG shares were first listed on the Warsaw Stock Exchange (September 23rd 2005), they have been among the most recognisable and credible listed securities. They have been included in the WIG20 index since December 15th 2005. Our stock is also included in the MSCI Emerging Markets Index, a global index of emerging market companies created by Morgan Stanley Capital International.
PGNiG was, for the sixth consecutive time, listed in the elite group of companies included in the RESPECT Index of socially responsible and sustainable businesses, the first such index in Central and Eastern Europe. Our stock is also a part of the WIG-Paliwa (WIG-Fuels) index of fuel sector companies, and of the WIG-div index of listed companies declaring dividend on a regular basis.
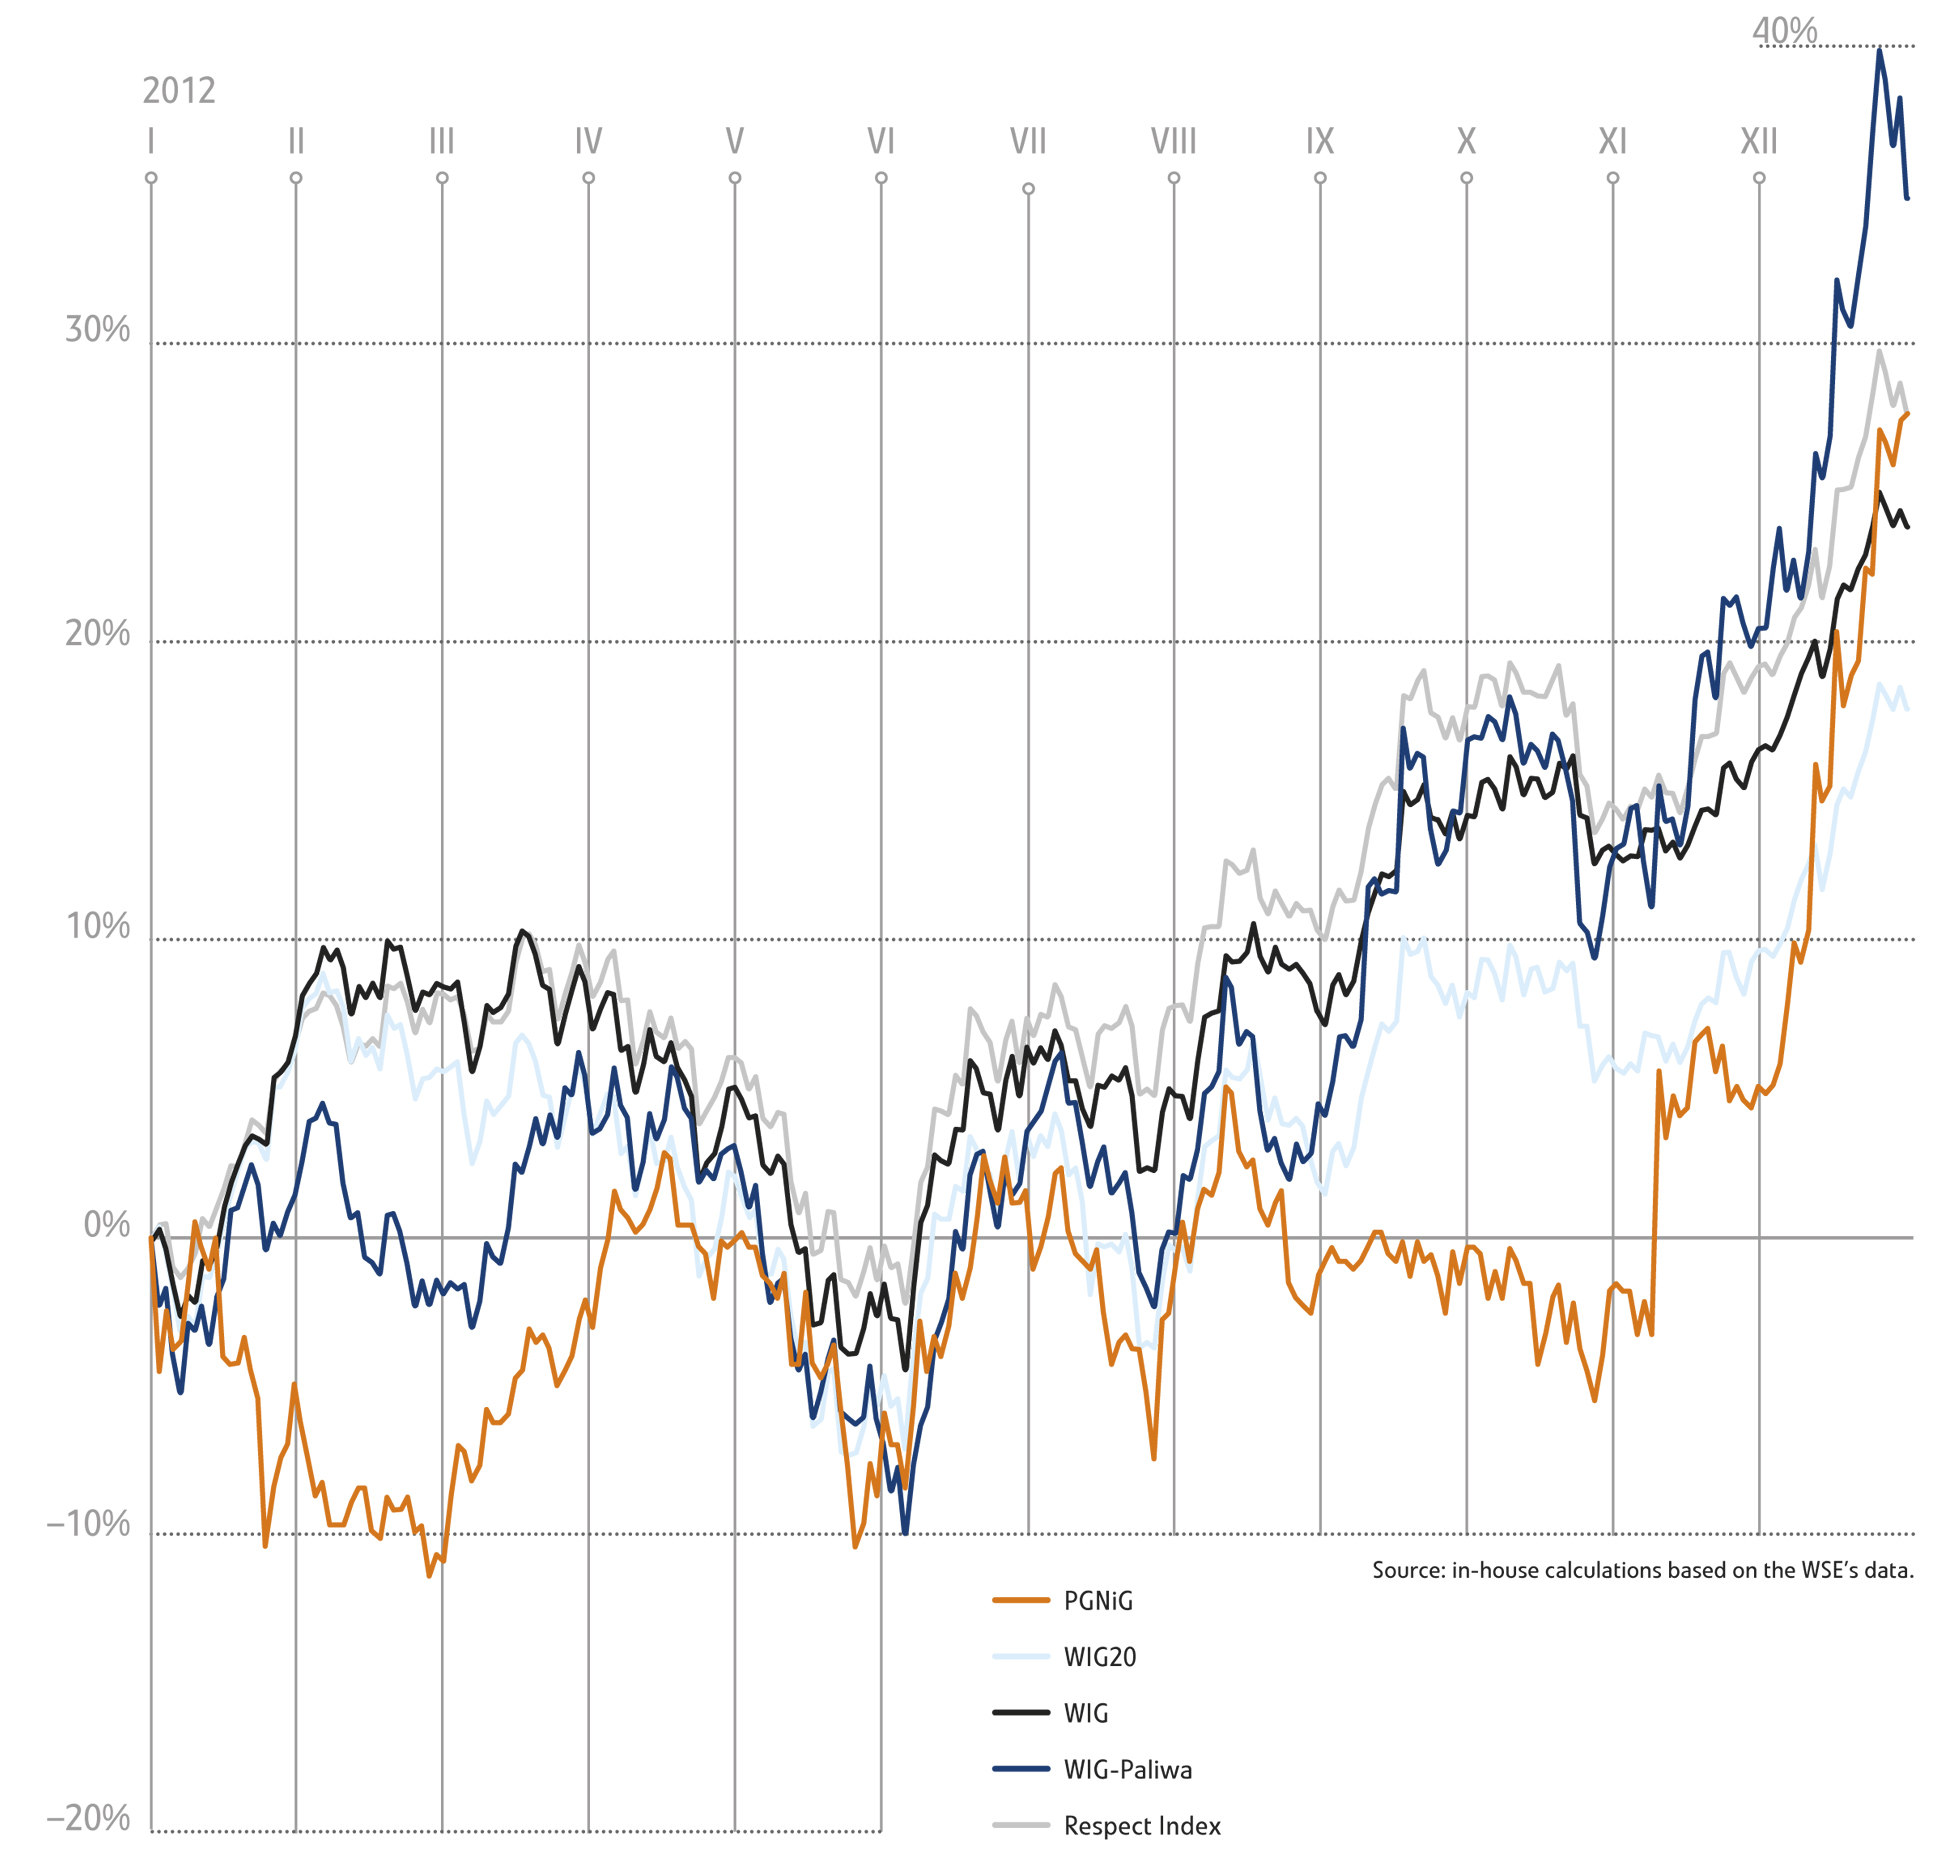
Performance of the PGNiG stock
Over 2012, the PGNiG stock was trading within the PLN 3.62–PLN 5.21 range. For a major part of the year, it was fairly stable, oscillating between PLN 3.62 and PLN 4.29. However, until December 2012 its growth failed to keep pace with the WIG20 index of blue-chip names. The PGNiG stock bottomed out in the last week of February, when demand for gas was high, but the then effective tariff did not account for the cost of gas acquisition. A steep upward climb of its price started after amendments to the Yamal Contract were agreed in November 2012 – from then on it surged by 30%, reaching its high on the last trading day of the year.
The rate of return on PGNiG stock in 2012 was 28%. In 2012, no dividend was paid. The rate of return on the investment in PGNiG shares for investors who bought the shares at the issue price had reached 75% by the end of 2012 (excluding dividend yield). The broad-market WIG index and the blue-chip WIG20 index also ended the year in the green zone, having returned 24% and 18%, respectively. From among the indices which include PGNiG, the best performer was WIG-Paliwa, which gained nearly 35%.
Performance of WSE indices and the PGNiG stock
| Index | Value/price as at Dec 31 2011 | 2012 high | 2012 low | Value/price as at Dec 28 2012 | PGNiG’s weight in WSE indices |
|---|---|---|---|---|---|
| WIG | 37,595.44 points | 47,920.75 points | 36,653.28 points | 47,460.59 points | 3.50% |
| WIG20 | 2,144.48 points | 2,602.51 points | 2,035.8 points | 2,582.98 points | 4.98% |
| WIG-Paliwa | 2,567.58 points | 3,707.76 points | 2,387.66 points | 3,571.11 points | 31.32% |
| Respect Index | 2,005.14 points | 2,635.7 points | 1,987.1 points | 2,591.15 points | 11.22% |
| PGNiG | PLN 4.08 | PLN 5.21 | PLN 3.62 | PLN 5.21 | - |
| Source: gpwinfostrefa.pl | |||||
Rates of return on WSE indices and the PGNiG stock in 2009–2012, and total return since PGNiG’s IPO
| Rate of return in 2009 | Rate of return in 2010 | Rate of return in 2011 | Rate of return in 2012 | Rate of return since PGNiG’s IPO | |
|---|---|---|---|---|---|
| WIG | 46.90% | 18.80% | -20.80% | 23.80% | 42.80% |
| WIG20 | 33.50% | 14.90% | -21.80% | 17.70% | 5.10% |
| WIG-Paliwa | 28.90% | 26.40% | -18.50% | 34.80% | 0.3% (1) |
| Respect Index | 70.9%(2) | 32.20% | -12.90% | 27.60% | 159.1% (2) |
| PGNiG | 5.30% | -5.80% | 14.30% | 27.70% | 36.7% (3) |
| Source: the WSE |
(1) Computed in relation to the reference value of the index (reference date: December 31st 2005).
(2) Computed in relation to the reference value of the index (reference date: December 31st 2008).
(3) In relation to the issue price of PLN 2.98, the rate of return on PGNiG shares since the IPO stands at 74.8%.
Performance of the PGNiG stock
Shareholder structure
As at December 31st 2012, the share capital of PGNiG amounted to PLN 5,900,000,000. It comprised 5,900,000,000 shares, with a par value of PLN 1 per share. The shares of all series, that is Series A, A1 and B, were ordinary bearer shares and each share conferred the right to one vote at the General Meeting. The Company’s Articles of Association do not provide for any restrictions on the exercise of voting rights attached to the Company shares.
The State Treasury remains the Company’s majority shareholder. On June 26th 2008, the Minister of the State Treasury disposed of one PGNiG share on general terms, which – pursuant to the Commercialisation and Privatisation Act of 1996 – triggered the eligible employees’ rights to acquire free of charge a total of up to 750,000,000 PGNiG shares. The start date for executing agreements on free-of-charge acquisition of Company shares was April 6th 2009. The eligible employees’ rights to acquire PGNiG shares free of charge expired on October 1st 2010.
By December 31st 2012, nearly 60,000 eligible employees had acquired 728,189,045 shares, conferring the right to 12.34% of the total vote. Consequently, the State Treasury’s interest in PGNiG fell to 72.40%. The shares acquired free of charge by the eligible employees were locked up until July 1st 2010, while trading in the shares acquired by members of the Company’s Management Board was restricted until July 1st 2011.
Shareholder structure in 2011–2012
| Shareholder | Number of shares/votes attached to the shares as at Dec 31 2011 | Percentage of share capital/total vote at the GM as at Dec 31 2011 | Number of shares/votes attached to the shares as at Dec 31 2012 | Percentage of share capital/total vote at the GM as at Dec 31 2012 |
|---|---|---|---|---|
| State Treasury | 4,272,063,451 | 72.41% | 4,271,810,954 | 72.40% |
| Other shareholders | 1,627,936,549 | 27.59% | 1,628,189,046 | 27.60% |
| Total | 5,900,000,000 | 100.00% | 5,900,000,000 | 100.00% |
A significant percentage of PGNiG shares are held by open-end pension funds. As at the end of 2012, long-term investors held over 9% of PGNiG’s equity, valued at over PLN 2.8 bn. Compared with the year before, their PGNiG shareholdings increased by nearly one-third, reflecting confidence in the Company’s Strategy and recognition of its achievements in 2012, including renegotiation of the Yamal Contract and successful completion of the LMG and Skarv projects. The fact that pension funds, as stable financial investors, hold such a significant position in PGNiG confirms the Company’s long-term potential to deliver value to shareholders. It should also be noted that the interest of open-end pension funds in PGNiG’s equity has grown considerably since its IPO in 2005, when it stood at 3.5%, or PLN 711 m.
PGNiG shares in the portfolios of open-end pension funds
| No. | Fund | Value/price as at Dec 31 2012 | Number of shares as at Dec 31 2012 | Equity interest | Change 2012/2011 | Value/price as at Dec 31 2011 | Number of shares as at Dec 31 2011 | Equity interest |
|---|---|---|---|---|---|---|---|---|
| 1 | ING NATIONALE NEDERLANDEN OFE | 671,009,587 | 128,792,627 | 2.18% | 48.56% | 353,709,223 | 86,693,437 | 1.47% |
| 2 | AVIVA OFE | 593,151,534 | 113,848,663 | 1.93% | 18.16% | 393,106,490 | 96,349,630 | 1.63% |
| 3 | OFE PZU ZŁOTA JESIEŃ | 530,368,190 | 101,798,117 | 1.73% | 66.70% | 249,151,287 | 61,066,492 | 1.04% |
| 4 | AMPLICO OFE | 234,536,533 | 45,016,609 | 0.76% | 34.00% | 137,065,099 | 33,594,387 | 0.57% |
| 5 | AXA OFE | 213,325,195 | 40,945,335 | 0.69% | 9.21% | 152,965,030 | 37,491,429 | 0.64% |
| 6 | AEGON OFE | 100,016,193 | 19,196,966 | 0.33% | 15.30% | 67,928,389 | 16,649,115 | 0.28% |
| 7 | NORDEA OFE | 102,827,332 | 19,736,532 | 0.33% | 11.62% | 72,138,982 | 17,681,123 | 0.30% |
| 8 | ALLIANZ POLSKA OFE | 89,965,175 | 17,267,788 | 0.29% | 13.66% | 61,985,457 | 15,192,514 | 0.26% |
| 9 | GENERALI OFE | 71,407,072 | 13,705,772 | 0.23% | 10.97% | 50,391,256 | 12,350,798 | 0.21% |
| 10 | BANKOWY OFE | 77,013,465 | 14,781,855 | 0.25% | 10.88% | 54,392,908 | 13,331,595 | 0.23% |
| 11 | OFE POCZTYLION | 41,785,242 | 8,020,200 | 0.14% | 32.26% | 24,741,536 | 6,064,102 | 0.10% |
| 12 | PEKAO OFE | 38,752,027 | 7,438,009 | 0.13% | 93.62% | 15,673,145 | 3,841,457 | 0.07% |
| 13 | OFE WARTA | 26,407,463 | 5,068,611 | 0.09% | -6.85% | 22,199,574 | 5,441,072 | 0.09% |
| 14 | OFE POLSAT | 18,356,711 | 3,523,361 | 0.06% | 16.61% | 12,328,112 | 3,021,596 | 0.05% |
| Total | 2,808,921,718 | 539,140,445 | 9.14% | 31.89% | 1,667,776,488 | 408,768,747 | 6.93% | |
| Source: Polish Press Agency (PAP) | ||||||||
Investor relations
Investor relations is an increasingly prominent area of business activities. The importance of its role reflects the rapid growth of the capital market in Poland, which is evidenced by the growing value of assets held by investment funds, as well as the rising number of publicly-traded companies and retail investors who choose to invest their money through the Warsaw Stock Exchange.
It also follows from the increasing scope of legal and regulatory requirements imposed on companies by the legislator, and also by the market itself striving towards self-regulation. Last but not least, there is a growing awareness on the part of issuers that well-managed investor relations can support their financial strategy and foster their good image, which will eventually strengthen their competitive advantage.
In 2012, PGNiG released 191 reports, both periodic and current. It also kept updating and developing the Investor Relations section of its website (www.pgnig.pl) with the most up-to-date Group information, accessible to all capital market participants.
In addition to detailed information on the Company and a complete database of its periodic and current reports, it also contains the prices and charted performance of the PGNiG stock, investor presentations, as well as a list of broker recommendations for PGNiG.
As part of its investor relations in 2012, the Company’s representatives, including Management Board members and directors, held some 130 meetings with institutional investors and attended 14 conferences and road-shows. Apart from regular industry events (such as the Chemist Day or the Energy Sector Conference) and regional conferences, 2012 saw a number of meetings devoted to the debt market, in connection with the record issue of PGNiG notes on the Catalyst market and the need to build relations with investors who bought PGNiG eurobonds in 2011.